
How To Measure And Improve Your Landing Page Analytics?
A landing page is a great way to drive traffic, improve your SEO and build your brand. Online marketers have used the term “landing page” for many years to describe a sales tactic focused on getting people to take one, specific action on your website. Today it’s a required element in the marketing toolbox for every business. Landing Page Analytics can provide you with some great insights about the strengths and weaknesses of your lead generation efforts.
68% of B2B businesses use landing pages to generate leads for future conversion.
Ducttape Marketing simply defines a landing page as, “A Page people land on because an ad or email directed them to that specific page as opposed to your site’s homepage. Effective landing pages make it very clear what a visitor is going to get from a page and how to get it.”
Landing pages are often treated like websites. The goal of a landing page is to attract and convert users. The key benefit of a landing page over a traditional website is its adjustability. If you have new insights on how users convert on your landing page, you can quickly change the structure of your page. Measuring your landing page analytics will help you make these changes when necessary.
Keep running your business smoothly, while we take care of tedious-but-essential WordPress tasks with WPCruiseControl.
Landing page analytics tell you whether you’re doing it right!
In order to analyze your landing page’s metrics, you need a CTA. If you don’t have a clear understanding of your CTA, then how will your visitors? Concentrate on one single CTA, and make it so obvious and visible that it can’t be missed.
What To Measure On Your Landing Page Analytics?
Google Analytics provides a number of useful metrics that are meant to help us understand visitor behavior on our landing pages. You’ll want to keep an eye on the following 5 metrics specifically when reviewing page analytics:
Using videos on landing pages can increase conversions by 86%
1. Average Time On Page
Google Analytics records the time spent on a page only if a visitor navigates to another page on the same website. You cannot know the time spent on a page by a visitor who has visited only one page of a site.
Let’s say, a visitor arrives on your landing page, stays for 15 minutes and then leaves the site. Google will record the time spent on that page as 0:00. This calculation method easily distorts your engagement data for your landing page.
How do you fix this? Google’s Event Tracking API.
Inserting the “Track Event” JavaScript code to trigger every 10 seconds after loading a web page will record that a visitor is on a page.
2. Bounce Rate
A high bounce rate indicates that your landing page is ineffective. Not really! If a majority of users who visit your landing page leave without going to other pages on your site, your analytics will show a high bounce rate.
Someone who really bounces off a website spends a few seconds before deciding that this is not the site or page, that they were looking for. But the metric does not make a distinction between a person who spends a few seconds on the page or spends several minutes on it.
How do you fix this? Using Tracking Adjusted Bounce Rate In Google Analytics.
- You implement a small tweak to your Google Analytics code, which executes an event when a user has spent over a certain amount of time on the web page.
- Depending on the website, the time can range from 10 seconds to few minutes.
- Once the event is executed, the visitor is no longer counted as “bounce,” even though no additional page view is recorded.
- This will mean your bounce rate will show users who have not spent a required “minimal time” on your website.
Read more about it here!
3. Conversion Rate
In Google Analytics, the conversion rate is calculated based on the number of visits and not on the number of unique visitors. Is that a problem? Yes!
According to iProspect, “A customer’s consideration phase may include several visits to your landing page. Customers may read reviews about your business on another site, or compare your site with competitors before returning to convert on your landing page. This can result in several visits to your landing page (from the same visitor) with only a single conversion.
Using unique visitors to calculate the conversion rate will provide a more accurate representation of your customers’ purchasing cycle and provide a better measurement of your landing page’s success.”
4. Traffic Source/Medium
Understanding how users get to your site helps you create more effective landing pages for each channel. According to Kissmetrics, “It is important to have a diverse number of sources for incoming traffic. The three primary source categories are:
- Direct visitors – the ones that visit your site by directly typing your URL in their browser address bar,
- Search visitors – the ones that visit your site based on a search query, and
- Referral visitors – the ones that visit your site because it was mentioned on another blog or site.”
Your prospects can reach your landing page through emails, PPC ads, social media, direct traffic, and referral sites, and through a variety of other marketing channels. Landing page analytics tell you where they are coming from, majorly, so that you can concentrate on improving other channels.
5. Visitors Flow
Visitor flow data provides insight into a visitor’s path through your website. When viewed in the aggregate, patterns will emerge that may uncover issues with the website. A common pattern we don’t like to see is “pogo sticking”. When a user lands on the homepage, clicks to an internal page, then goes back to the home page, and so on.
If a user returns to the home page several times in one visit, it indicates that you aren’t providing clear directional cues to guide individuals through the site.
Marketers can gain some control over visitor flow with stronger CTAs. This keeps people on the site for longer and helps you place more relevant information in the right places.
These are a few other secondary factors that you could track:
- Campaign / Ad Group – The pay-per-click or other online marketing campaigns which brought in the visitor.
- Country/City – The physical location of the visitor (if known, detected by IP address)
- Device Category – A divide of Mobile, Tablets and Desktop device users
- Referral Path – Which previous URL the visitor came from (for referral traffic)
- Hour / Day / Month / Year – What time or date the user entered the landing page.
The knowledge of metrics with landing page analytics will allow you to accurately and precisely understand how well you’re doing with your landing pages.
5 Awesome Landing Page Analytics Tools
1. Crazy Egg
With CrazyEgg you can easily see which parts of your website visitors are engaging with, and which parts just fall flat. You can use this data to improve your navigation, layout, copy, and more. The visual format on Crazyegg really changes the way you can look at and interpret the data.
Online Marketing Institute, users of CrazyEgg, say, “ Instead of simply presenting numbers or graphs, the eye tracking reports on CrazyEgg clearly tie metrics back to content and design, so you can better see and understand what is happening on your website, and hopefully figure out why.”
2. Visual Website Optimizer
Visual Website Optimizer enables you to launch A/B tests on your landing pages and website without any coding or development resources. It starts at about $49 a month, so if you save even 10 minutes a month on your landing page testing, the solution pays for itself.
3. Unbounce
If you like to achieve big wins with a small budget, Unbounce is the perfect solution for you. It comes ready-baked with dozens of pre-designed landing page templates. It also integrates with popular tools like HubSpot and MailChimp, so you can create a page, launch a test, and push all the new leads you captured right into your email marketing solution.
4. Optimizely
Optimizely allows you to make the most of your current marketing strategy. It helps track down user experiences on the website through its efficient analytics. Since customer behaviors keep changing all the time, Optimizely enables you to track down these subtle and abrupt changes and therefore, you can design your platforms in a much more interactive and efficient manner.
5. Ion Interactive
The platform enables you to quickly create effective and beautiful landing pages in just minutes, with some converting at over 50%, depending on the stream of traffic. Since analytics, creation, and testing are all part of the interface, you can quickly launch campaigns in the morning and monitor your results throughout the day. Ion platform makes achieving big wins a daily occurrence.
Here’s an interesting article on 7 Awesome Tools For Landing Page Analytics!
How to Measure Landing Page Performance With Google Analytics
Using any web analytics tool you can measure the performance of your landing page and find the entire report showing specific statistics for the different web pages visitors landed upon. This is how you can do it on Google Analytics:
Step 1: Behaviour > Site Content > Landing Pages
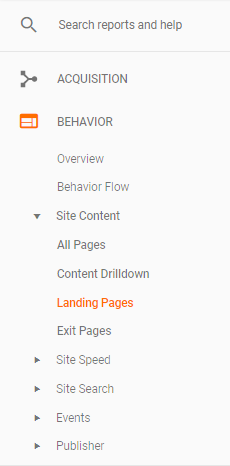
As soon as you open the report, you’ll see the most popular landing pages on your website, arranged by a number of visitors that have landed on each page over the specified time period. You can change the time period and also compare it with another time period to measure the performance!
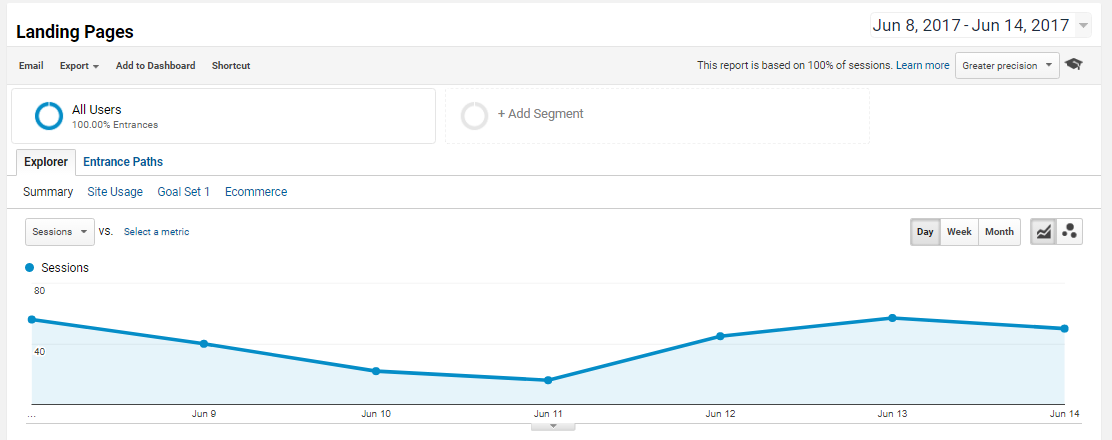 In addition to visits, the Landing Pages report shows us a bunch of useful data as discussed earlier, including:
- Pages/Visit
- Avg. Visit Duration
- Percentage Of New Visits
- Bounce Rate
Questions That Your Landing Page Analytics Help You Answer:
- What pages are serving as an introduction to your website?
- How well is each landing page performing?
- Which blog posts are driving the most traffic to my website?
- What pages are different segments of traffic landing on?
- How well is each landing page converting?
If you want to get even more specific with the Landing Page reports you run, you can apply Advanced Filters.
- Click “advanced” above the data tables.
- Enter the criteria you’d like to use to create your filter.
- Click the “Apply” button underneath your filter criteria.
- Your data will now be filtered by whatever criteria you’ve specified.
You can add a secondary dimension to the landing page report allowing you to cut off segments of visitors for each landing page. Like for example, you could filter out a report for a particular source by selecting “Source” as the secondary dimension and give a keyword.
You can segment the landing page statistics by any secondary dimension you wish.
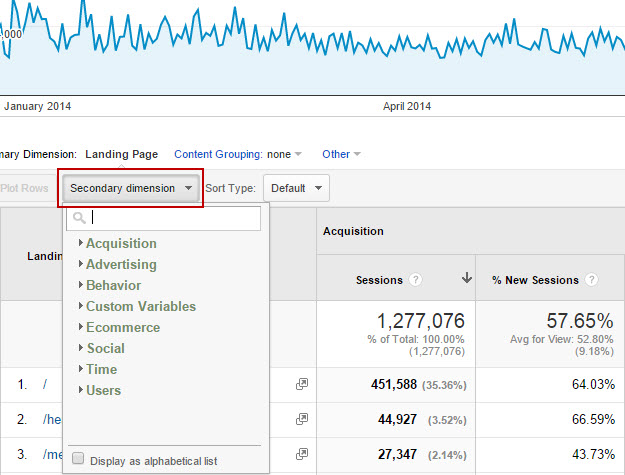
Image Source: Hallaminternet
Have a try at segmenting by “Medium” to see to differences between direct, paid and organic traffic on each landing page. You can use two filters if you wish to focus on a single landing page.
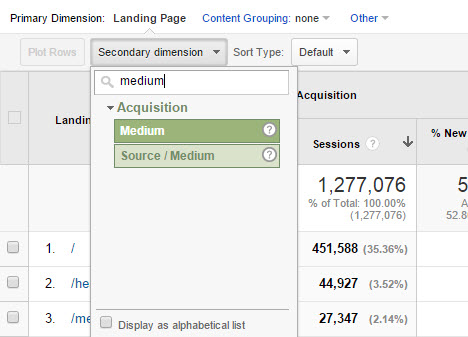
Image Source: Hallaminternet
This results in a view of a single landing page showing statistics for all the different mediums of traffic, a very useful tool for improving overall sales or leads.
Read our Blog post on The Ultimate Guide to Designing The Perfect Landing Page For every information on Landing Page Design!
Conclusion:
Splitting the landing page data up by different dimensions allows you to drill down into specific segments of visitors and will highlight the best and worst performers even more accurately.
Once you have collected the data, the challenge is using it to make your business stronger.
On its own, the data is simply a window to the past. You need context for the numbers so that you can make sound business decisions. The landing page report measures how you introduce your site to potential customers, and reacquaint it with old ones.
As Pamela Vaughn, Principal Marketing Manager at HubSpot puts it, “By tracking and analyzing the metrics associated with your landing pages, you can collect a lot of insight into your marketing performance, such as how your various marketing offers to compare, how visitors and leads are converting on your landing pages over time, and more.”
Have you ever used the Landing Pages report in Google Analytics? We’d love to hear your experience with Landing Page Analytics!


Hey, Nithya. It was a resourceful article.
It’s of utmost important that online business owners should create dedicate landing pages to boost their online conversion. A tailored landing page, highlighting what benefit a lead/ visitor gets when interacting with the enterprise increases the confidence. WordPress makes this simple, the plethora of tools available makes it easy to create interactive lading pages. Embedding a customer testimonial in video format gives a face and authority to the service provided.
Combining GA & other third part tools with lading pages help a business entity to gather immense qualitative data on how visitors feel about the landing page, and the data can be used to further optimise landing pages to linger with the end objective.